


Church leaders spend a lot of time talking about generosity. But how well do we actually understand it?
The gap between what churches hope their congregations are giving and what congregants are actually giving is wider than most realize. At the same time, there are real, data-backed reasons for optimism, particularly around digital giving adoption, Millennial generosity, and recurring giving growth.
This post pulls together 102 verified church giving statistics from our own research and the most credible sources available: Giving USA, Barna Group, Gallup, Lifeway Research, Lake Institute on Faith & Giving, MortarStone, Nucleus Church, Vanco, Ministry Brands, and more. The data spans tithing behavior, online giving trends, generational shifts, church attendance, and the financial health of congregations nationwide.
Whether you’re a pastor preparing a stewardship campaign, a church administrator planning next year’s budget, or a ministry leader trying to understand your congregation better. This is the data you need.
Table of Contents
- Tithing & Theology
- Average Giving Amounts
- Online & Digital Giving
- Recurring Giving
- Giving Timing & Frequency
- Generational Giving
- Church Attendance Trends
- Religious Giving Overview
- Church Budget & Financial Health
- Why People Give (and Why They Don’t)
- How Churches Allocate Donations
- Legacy and Planned Giving
Tithing & Theology
Tithing is one of the most discussed, and least practiced, disciplines in the church. The data reveals a significant gap between what Christians believe about giving and what they actually do.
- Only 27% of churchgoers tithe at or above the traditional 10% mark of their income, and that number has remained largely unchanged in recent years. [1]
- Only 5–10% of church attendees follow traditional tithing behavior, yet 77% of those committed tithers give above and beyond the 10% mark. [2]
- A study found that only about one quarter of congregation members tithe, and 2.5% of income is the average giving level across all church attenders. [1]
- 77% of American Protestant churchgoers affirm that “tithing is a biblical command that still applies today,” down from 83% in 2017. [3]
- Denominational giving rates vary widely: Baptist (40%), Presbyterian/Reformed (34%), and non-denominational (34%) churchgoers are most likely to tithe; Lutheran (19%), Restorationist (17%), and Methodist (12%) are least likely. [3]

- Those with evangelical beliefs are significantly more likely to tithe than those without (39% vs. 25%). [3]
- Churchgoers who attend services at least four times a month (34%) are more likely to tithe than those attending one to three times per month (26%). [3]
- Of those who gave in 2024, only 8.9% were classified as tithers, roughly “1 in 20 attendees,” according to MortarStone’s analysis of 537 churches. [4]
- 57% of churchgoers who attend services at least weekly say they give at least a tithe, dropping to 28% for those who attend only once or twice a month. [5]
- About 10 million tithers in the U.S. donate an estimated $50 billion yearly to churches and nonprofits. [6]
- 7 out of 10 tithers base their giving on gross income rather than net income. [6]
- 52% of churchgoers say their church teaches “God will bless them if they give more money to the church,” a prosperity gospel belief, up from 38% in 2017. [7]
Average Giving Amounts
How much is the average churchgoer actually giving? The answer depends heavily on how you measure it and who you’re measuring.
- The average donation to a church is $210, based on analysis of $627 million in real donations processed by Nucleus Giving across churches in the U.S. and Canada in 2024. [8]
- Average per-person church giving in 2022 was $2,848, equating to roughly 4.35% of household income (based on average U.S. personal income of $65,423). [2]
- The average weekly giving per person across all church sizes is $29.63, based on combined attendance. [9]
- The average Evangelical donor gave $2,503 to church in the prior 12 months, a 15% inflation-adjusted decline from $2,953 in 2021. [10]
- Median household giving per church declined 34%, from $910 in 2021 to $600 in 2024, according to MortarStone’s analysis of 537 churches. [11]
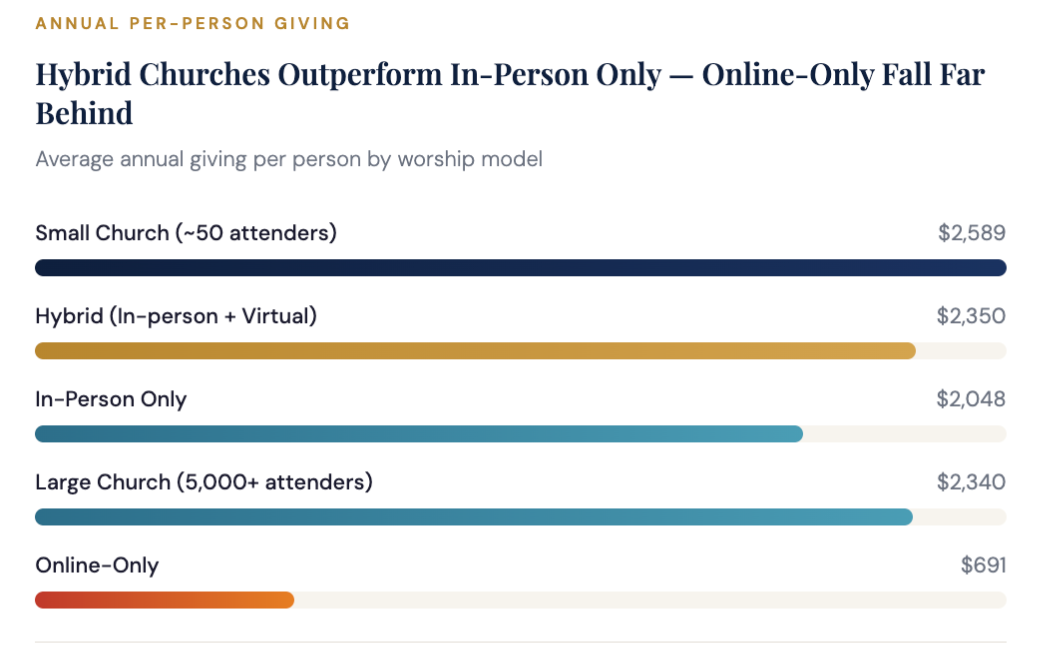
- Smaller churches (around 50 attendees) averaged $2,589 in annual per-person giving, while larger churches (5,000+ attendees) averaged $2,340. [1]
- Hybrid worship model churches (in-person + virtual) averaged $2,350 per capita vs. $2,048 for in-person-only churches. [1]
- Online-only churches average just $691 per person annually in giving, significantly below hybrid and in-person models. [1]
- 44% of all online church gifts are under $100, yet those gifts account for only 8.22% of total giving volume. [8]
- Only 2.96% of online church gifts exceed $1,000, yet those gifts account for 28.24% of total giving volume. [8]
- Among 37,000+ surveyed churches, the average gift was $157, derived from over 11.5 million gifts totaling $1.8 billion. [12]
- 60% of religious donors gave $1,000 or more to their congregation in 2023; 81% gave the same or more compared to the year prior. [1]
Online & Digital Giving
Digital giving is no longer optional. It’s the norm. And for churches that have leaned into it, the results are measurable.
- About 50% of all church donations now come via card or online methods. [1]
- 98% of places of worship offered digital giving in 2023, up from 64% pre-COVID. [1]
- As of 2025, churchgoers are evenly split: 50% eGivers and 50% traditional (cash/check) givers. [1]
- 50–61% of churches saw an increase in digital giving in 2024, with no corresponding decline in traditional cash or check giving. [1]
- Churches that promoted online giving saw a 32% increase in overall donations. [6]
- 44% of U.S. adults prefer digital forms of giving, according to Barna’s “Meet the Digital Donor” report. [13]
- 69% of digital donors agree they have “a strong curiosity about unfamiliar things,” 16 points higher than analog donors. [13]
- 61% of digital donors feel comfortable giving to nonprofits online, versus only 31% of analog donors. [13]
- 84% of digital donors trust that their personal information is safe when giving online; only 34% of analog donors feel the same. [13]
- In 2024, 40% of donors reported using their phone to tithe, up from 34% in 2022. [14]
- 71% of Millennials and 89% of Gen Z who have donated at church have done so through an online giving platform. [14]

- 73% of churches experienced increased or steady adoption of digital donation methods in 2023. [15]
- Larger churches (48%) report higher adoption of digital giving compared to smaller congregations (36%), highlighting a digital divide by church size. [15]
Recurring Giving
If there’s one lever churches consistently underutilize, it’s recurring giving. The data on its impact is hard to ignore.
- In 2024, recurring gifts accounted for 42% of digital giving and 57% of digital transactions, even though many churches didn’t actively promote the option. [1]
- Recurring online givers give 120% more annually than non-recurring online givers, a pattern visible across all church attendance sizes. [16]
- 22.11% of all online givers are recurring givers, yet that group accounts for 40.25% of all giving volume. [8]

- Recurring digital donations grew 4.9% in transactions and 6.3% in dollar value from 2022 to 2023 across Ministry Brands churches. [15]
- In 2023, recurring donations constituted 43% of all digital transactions and 34% of total digital giving dollars. [17]
- Donors who enroll in recurring giving contribute 42% more annually than one-time donors. [18]
- 57% of nonprofit donors are now enrolled in a recurring giving program, up from 46% the prior year. [14]
Giving Timing & Frequency
When people give matters almost as much as how much they give. Understanding giving patterns helps churches plan campaigns, set budgets, and reduce volatility.
- Only 5.60% of givers donate weekly, yet that group contributes 19.07% of total giving volume. [8]
- 18.20% of givers donate monthly, and that group contributes 52.02% of total giving volume. [8]

- 76.21% of givers donate yearly or intermittently, yet that large group accounts for only 28.91% of total giving. [8]
- Sunday is the single most popular giving day (26.27% of weekly volume), yet more than 70% of all church giving now happens outside of Sunday. [8]
- Saturday is the least popular day of the week for church giving, at only 9.49% of weekly volume. [8]
- December is by far the most popular month for church giving at 13.79% of annual volume; January is the lowest at 6.98%. [8]
- In a study of 37,000+ churches, more than one-third (38.74%) of all gifts come in on Sunday, and nearly one-third of total giving value also arrives on Sunday. [12]
- Weekly giving has declined from 49% of givers in 2015 to 39% in 2025, though it has bounced back to pre-pandemic levels. [1]
Generational Giving
The generational shift in church giving is one of the most strategically important trends for church leaders to understand. The picture is more nuanced, and more hopeful, than many assume.
- Millennial giving per household increased 22% in 2024 and has now surpassed Gen X giving, according to the Giving USA Giving by Generations report. [11]
- Millennials’ church giving participation rate (42%) is 12 percentage points higher than Baby Boomers’ (30%). [2]

- Millennials (61%), Gen X (58%), and Boomers (64%) show remarkably similar overall charitable giving participation rates. [19]
- 90% of Millennials consider charitable giving an essential part of their lives. [2]
- 51% of Gen Z have given financially to charitable organizations, including churches, a lower rate than older generations largely due to their life stage. [19]
- 35% of Gen Z and 29% of Millennials feel young adults are more generous than their elders, compared to 53% of Boomers who believe the opposite. [19]
- From 2016 to 2022, donations to faith-based organizations grew 130% among Millennials and 51% among Gen X. [20]

- Gen Z and Millennials are the generations most likely to volunteer their time to an organization, a generosity signal that is expected to translate to financial giving as they age. [19]
- Young adults ages 24–34 are the most likely to give more than 10% of income; older adults ages 66–72 are most likely to give less than 4%. [1]
- Millennials now report a 39% weekly church attendance rate, up significantly from 21% in 2019, surpassing Baby Boomers for the first time. [21]
- 47% of Millennials prefer to donate to an organization through its website, reflecting their digital-first giving preference. [6]
- 21% of total church giving comes from just the top 1% of donors, most of whom are over the age of 60, creating a long-term sustainability risk. [22]
- The average church depends on its top 1% of givers for 21.2% of annual giving, while the median amount given by those top 1% rose 47% from 2021 to 2024. [4]
- Generation X has overtaken Baby Boomers as the leading generational contributor to total church giving, though it took significantly more Gen X donors to do so. [22]
Church Attendance Trends
Giving and attendance are closely linked. Understanding where attendance is headed helps churches anticipate giving trajectories and plan accordingly.
- Only 20% of Americans now attend church weekly, down sharply from 32% in 2000, a continuation of a two-decade decline. [23]
- 57% of Americans say they seldom or never attend church, a dramatic increase from just 13% in 2000. [23]
- Church membership in the U.S. fell below 50% for the first time in Gallup’s 80-year history in 2021, and dropped to 45% in 2023, down from 70% in 1999. [24]
- Just 3 in 10 U.S. adults attend religious services regularly (21% weekly, 9% almost weekly), according to a Gallup poll released March 2024. [25]
- 44% of Protestants/non-denominational Christians attend services regularly; 38% of Muslims; 33% of Catholics; and 67% of Mormons, per Gallup’s 2021–2023 aggregate survey. [25]
- The number of U.S. adults identifying as “practicing Christians” dropped from 45% in 2020 to 20% in 2024. [23]
- Only 42% of Millennials are church members, compared to 62% of Gen X at a similar age, reflecting a generational shift in institutional affiliation. [26]
- Small group participation among worship attendees dropped from 50% in 2008 to 44% in 2022, weakening a key driver of deeper giving engagement. [7]
- Approximately 3,500 people left religious congregations every single day pre-pandemic, a rate of 1.2 million per year. [21]
- 56% of churches reported higher giving and 56% reported attendance growth in 2024, according to Horizons Stewardship survey data. [27]
- Households committed to a small group, Sunday school, or serving ministry give over 40% more than regular worship attenders who are not involved in such activities. [27]
- Larger churches with annual giving exceeding $5M experienced a 79% increase in giving and 91% rise in attendance in 2024; only 29% of churches with budgets under $100K saw giving growth. [27]
Why People Give (and Why They Don’t)
Understanding the “why” behind giving is just as important as tracking the numbers. Generosity rarely happens in a vacuum. It’s shaped by trust, engagement, mission clarity, and the degree to which a congregant feels genuinely connected to what their church is doing.
The trust gap is real and worth taking seriously. Only 22% of donors say they have high trust in the charitable organizations they give to, even though 67% identify trust as a prerequisite for giving. For churches, this creates both a problem and an opportunity. Congregants who feel informed, included, and spiritually engaged give more. Those who feel disconnected from leadership or uncertain about how funds are used tend to give less, or not at all.
Engagement is the most consistent predictor of generosity. The data bears this out across multiple studies: attendance frequency, small group participation, and serving involvement all correlate strongly with higher giving levels. A churchgoer who attends weekly and participates in a small group is a fundamentally different financial contributor than one who shows up monthly and has no other touchpoints with the congregation.
There are also structural barriers that get less attention than they deserve. The shift toward digital-first lifestyles means that a church without accessible online giving is asking some donors to do something that feels genuinely inconvenient. For younger congregants especially, the friction of cash or check can be enough to suppress giving altogether. Digital adoption doesn’t just open a new channel; it removes a barrier.
The prosperity gospel data (stat #12) points to a subtler motivation barrier: theology shapes behavior. Congregants who give primarily because they expect a material return are a fragile donor base. Churches that root their stewardship culture in mission, generosity as spiritual formation, and tangible community impact tend to build more durable giving habits over time.
Religious Giving Overview
Zooming out to the macro picture: how does church and religious giving fit into the broader landscape of American philanthropy?
- Total U.S. charitable giving reached $592.50 billion in 2024, an increase of 6.3% in current dollars (+3.3% inflation-adjusted), the first real increase in three years. [28]
- Giving to religion in 2024 was estimated at $146.54 billion, representing a 1.9% nominal increase that translated to a 1% decrease when adjusted for inflation. [29]
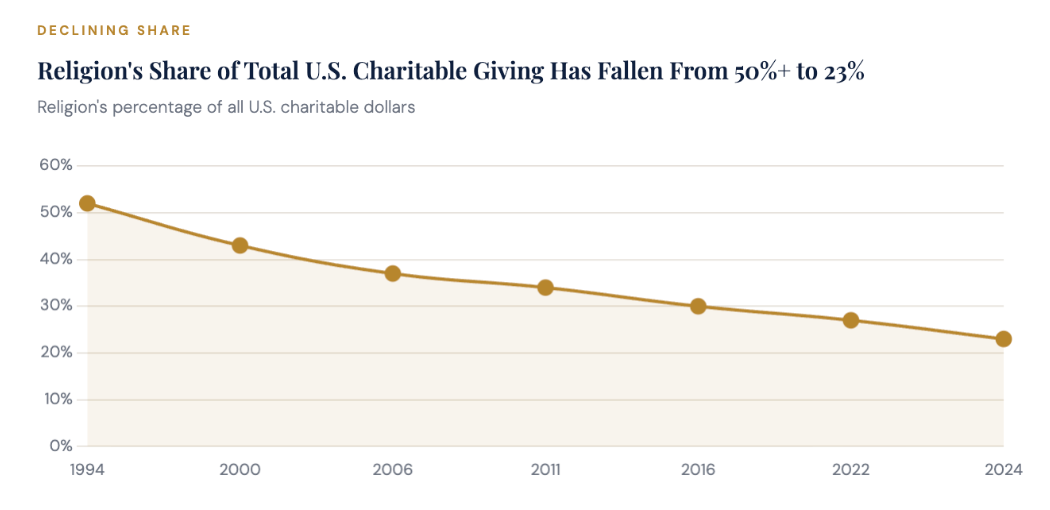
- Religion received 23% of all U.S. charitable dollars in 2024, the largest single sector share, but down from 34% in 2011 and over 50% in 1994. [29]
- Total giving from 2022–2024 increased 8.7%, while giving to religion only increased 2.8% over the same period, underperforming the broader philanthropic sector. [29]
- Despite nominal growth in religious giving, it was the only major giving subsector to decline in inflation-adjusted terms in 2024. [28]
- Individual donors gave $392.45 billion in 2024, comprising 66% of all charitable giving and the bedrock of church funding. [28]
- 97% of faith-based individuals contributed financially, with donations, items, or time in 2023; 90% of revenue for religious organizations comes from individuals. [20]
- In 2022, giving to religion had a 5.2% nominal increase but declined 2.6% in inflation-adjusted terms, masking a real-dollar loss. [30]
- The proportion of Americans who are religiously unaffiliated grew from 21% to 26% between 2013 and 2023, a key structural driver of declining religious giving. [29]
- In 2024, 50% of pastors reported giving matched their budget and 16% exceeded it; 29% said giving rose compared to prior year, while 24% said it fell. [1]
- Religious institutions received only 17.9% of holiday giving in 2025, ranking third behind food banks and shelters (31.5%) and local community groups (19.3%). [33]
- 63% of Americans say charitable donations make a bigger impact than consumer spending during the holiday season, according to Fellowship Development’s 2025 Holiday Giving Report. [33]

How Churches Allocate Donations
Most churchgoers have no clear picture of where their giving actually goes. That information gap matters more than many church leaders realize, because donors who understand how their contributions are used give more consistently and at higher levels than those who don’t.
The typical church budget is dominated by two categories: staff compensation and facilities. By most estimates, personnel costs alone account for 40 to 60 percent of church operating expenses, with facilities costs consuming another significant share. That leaves a smaller portion for ministry programming, outreach, and benevolence funds, which are often the line items most visible and meaningful to congregants.
Directed giving has grown steadily as a result. Vanco’s Churchgoer Giving Study found that the share of donors designating gifts to specific causes or funds rose from 27% in 2015 to 31% in 2025. This isn’t a protest against general fund giving so much as it reflects a broader shift in how donors across all sectors think about their contributions. People want to see the connection between their dollar and a specific outcome.
That preference should inform how churches communicate about stewardship. Campaigns that are anchored to a concrete mission or project, a new youth ministry space, a benevolence fund serving families in crisis, a capital initiative expanding community programs, tend to outperform vague “support the church” messaging. The crowdfunding data in this post reinforces it: campaigns with regular progress updates generate 126% more in donations, and those featuring video raise 150% more on average. Transparency and story aren’t just nice to have. They’re the mechanism through which trust converts into giving.
For churches considering a capital campaign, this dynamic is particularly relevant. Major gifts decisions are rarely made on instinct. They’re made by donors who understand the vision, believe in the leadership, and can clearly see the impact their investment will make.
Church Budget & Financial Health
Behind every church’s giving data is a story about financial management, reserves, debt, and institutional sustainability.
- 78% of surveyed churches reported that annual giving consistently met or exceeded their budget over the last three fiscal years. [9]
- 58% of churches were debt-free in 2024, up from 50% in 2023. Of indebted churches, the average debt load was $3.77 million per church. [9]
- Emerging megachurches were the most likely to carry debt at 83%, while very small churches had the lowest debt rate at 21%. [9]
- Churches reported having an average of 22 weeks of cash reserves in 2024, down from 30 weeks in 2023. 43% had 12 weeks or fewer, up from 30% the prior year. [9]
- Church financial crime worldwide jumped from $67 billion in 2020 to $92 billion today and is projected to reach $400 billion by 2050. [9]
- 1 in 13 (8%) U.S. Protestant churches have had someone embezzle money from the church, per a Lifeway Research study. [9]
- 55% of churches in 2023 reported a decrease in giving due to inflation; 65% reported a moderate or severe increase in operating costs. [17]
- MortarStone found churches are missing dates of birth on 47.6% of their givers, a significant gap in the donor data most churches rely on for stewardship strategy. [4]
- A study by Parable found their church partners experienced an average 17% increase in overall donations in 2024, with many seeing double-digit growth. [31]
- Church crowdfunding campaigns that update supporters receive 126% more donations than campaigns that do not post updates. [32]
- Church crowdfunding campaigns that feature videos raise 150% more on average than those without videos. [32]
- 67% of donors say establishing trust is crucial before giving to a cause, yet only 22% say they have high trust in the charities they give to. [14]
Legacy and Planned Giving
Planned giving is one of the most underdeveloped opportunities in church stewardship, and most congregations aren’t having the conversation at all.
A bequest or planned gift, whether through a will, a trust, a beneficiary designation, or a gift annuity, represents a donor’s final and often largest act of generosity toward an organization they cared about during their lifetime. For churches, this kind of giving can fund endowments, capital projects, or ministry initiatives in ways that annual giving simply can’t. Yet surveys consistently show that the vast majority of congregants have never been asked by their church to consider a planned gift.
The demographics make this urgent. As the data in this post shows, the top 1% of church givers, who account for more than a fifth of total giving in the average congregation, are predominantly over the age of 60. That’s the same generation most likely to be in active estate planning conversations with financial advisors and attorneys. The window to cultivate those relationships is now.
The barrier isn’t donor reluctance. Most legacy givers say they weren’t solicited, they just hadn’t thought about it. Legacy giving cultures tend to grow where churches make the ask explicitly and repeatedly, honor existing legacy donors publicly, and make the mechanics of giving easy to understand. A simple acknowledgment in a bulletin, a dedicated page on the church website, or a personal conversation between a pastor and a high-capacity donor can be enough to plant the seed.
Planned giving doesn’t require a large endowment program or a development staff. It requires a church that is intentional about telling donors they can make a lasting difference, and then making it easy for them to do so.
Strategies for Increasing Church Giving
The data in this post points toward some clear, actionable patterns. Churches that are growing their giving aren’t doing so by hoping for a cultural reversal in tithing rates or waiting for attendance to bounce back on its own. They’re making deliberate choices about how they communicate, who they cultivate, and what tools they use.
Make recurring giving the default ask. The case for recurring giving is one of the most lopsided in all of church finance. Recurring givers contribute 120% more annually than one-time givers, they account for 40% of all giving volume despite being just 22% of the donor pool, and their giving is more predictable, which makes budgeting more reliable. Yet many churches still treat it as an afterthought. Promoting recurring giving actively, not just making it available, is one of the highest-return moves a church can make.
Use data to understand your donor base. MortarStone’s analysis found that churches are missing birth dates on nearly half their givers, and that only a fraction of households recorded in church management systems have made a recordable gift. That’s not just a data hygiene problem; it’s a stewardship strategy problem. Knowing who your top 20% of givers are, what their giving history looks like, and when they’re most likely to lapse or increase is the foundation for personalized outreach that actually works. Generic appeals go to everyone and move no one.
Communicate with specificity and transparency. The directed giving trend is a signal worth heeding. When donors can see exactly where their contribution is going, giving increases. This applies to special campaigns, capital projects, and benevolence funds, but it also applies to general fund stewardship. Churches that provide regular financial updates, whether through bulletin inserts, annual reports, or short pastor-led videos, build the kind of trust that converts casual attenders into committed givers. The crowdfunding data makes this concrete: campaigns that provide updates outperform those that don’t by 126%.

Prioritize generational engagement now, not later. Millennials are giving at higher rates than commonly assumed and have now surpassed Gen X in per-household giving growth. But they have different expectations: they give digitally, they want to understand the impact of their gift, and they’re more likely to give to a specific cause than to an undifferentiated general fund. Churches that build stewardship cultures with these preferences in mind, rather than retrofitting Boomer-era communication norms, are better positioned as the generational wealth transfer accelerates.
Invest in the right capital opportunities. For churches considering major initiatives, whether a building project, an endowment, or a significant ministry expansion, the data is clear that larger churches with strong giving cultures and active engagement programs are seeing outsized results. A 79% increase in giving at churches with annual budgets over $5M in 2024 wasn’t accidental. It reflects the compounding effect of trust, leadership clarity, and strategic campaign execution over time. Churches that approach capital campaigns with professional support, clear vision, and a cultivated major donor base consistently outperform those that treat fundraising as a once-every-decade scramble.
Say thank you, and mean it. Donor acknowledgment is one of the most underleveraged tools in church stewardship. Research across the broader nonprofit sector consistently shows that timely, specific, personal thank-you communications improve donor retention meaningfully. A phone call from a pastor to a first-time giver. A handwritten note to a major donor at year-end. An email that names what the gift made possible. These aren’t just courtesies; they’re retention strategies.
What These Church Giving Statistics Mean for Your Ministry
The data tells a story that’s both sobering and full of opportunity.
The sobering part: fewer Americans are attending church, tithing rates remain low, and religious giving is underperforming the broader philanthropic sector in real-dollar terms. The donors who carry most of the financial weight, older high-capacity givers, represent a sustainability risk as they age.
The opportunity: digital giving is growing without cannibalizing traditional giving. Millennials are attending and giving at higher rates than previously measured. Recurring giving consistently delivers dramatically better results when promoted. And churches that actively engage their congregations, through small groups, digital tools, and transparent communication, are seeing measurable results.
The churches thriving financially aren’t doing so by accident. They’re leveraging data, investing in donor relationships, and meeting their congregations where they are, including online.
Sources
[1] Vanco Churchgoer Giving Study (2025): https://www.vancopayments.com/egiving/asset-church-giving-statistics-tithing
[2] CareyNieuwhof.com / Church Salary (2025): https://careynieuwhof.com/church-giving-statistics/
[3] Lifeway Research (April 2023): https://research.lifeway.com/2023/04/25/churchgoers-are-still-tithing-more-comfortable-doing-so-outside-of-church/
[4] MortarStone / Christian Stewardship Network (2025): https://www.christianstewardshipnetwork.com/blog/2025/4/2/top-4-church-giving-trends-from-the-2024-generosity-report-and-what-to-do-about-them
[5] Lifeway Research / Baptist Press: https://www.baptistpress.com/resource-library/news/churchgoers-say-they-tithe-but-not-always-to-church/
[6] Nonprofits Source (2024): https://nonprofitssource.com/online-giving-statistics/
[7] Lifeway Research / Baptist Messenger (2024): https://www.baptistmessenger.com/lifeway-research-10-trends-impacting-the-church-in-2024/
[8] Nucleus Church Giving Statistics 2025 Report: https://www.nucleus.church/blog/church-giving-statistics
[9] Christian Standard – 2024 Church Survey (July 2025): https://christianstandard.com/2025/07/beyond-the-budget-navigating-church-giving-and-finances/
[10] Christian Post / Infinity Concepts & Grey Matter Research (2024): https://www.christianpost.com/news/evangelical-giving-to-churches-is-way-down-new-study-suggests.html
[11] Lake Institute / MortarStone 2024 Annual Report (July 2025): https://lakeinstitute.org/resource-library/insights/july-15-2025/
[12] UMF / MinistryBrands 2024 Giving Survey: https://umf.org/church-leadership/2024-church-giving-trends-and-insights-from-37000-churches
[13] Barna Group – Meet the Digital Donor (2023): https://www.barna.com/research/digital-donors/
[14] Subsplash Church Giving Statistics (2025): https://www.subsplash.com/blog/church-giving-statistics
[15] Ministry Brands 2024 State of Church Giving Report: https://www.prnewswire.com/news-releases/ministry-brands-2024-state-of-church-giving-report-reveals-churches-using-digital-giving-platforms-experienced-an-uptick-in-automatic-recurring-giving-302053988.html
[16] Vanco Benchmark Giving Study – 25,000 Churches: https://www.vancopayments.com/egiving/asset-church-giving-benchmarked-insights-from-25000-churches
[17] Ministry Brands 2024 State of Church Giving Report (PDF): https://www.catholiccommunity.org/files/resources/ministrybrands2024stateofchurchgivingreport.pdf
[18] OnlineGiving.org – Digital Giving Trends 2025: https://www.onlinegiving.org/support/digital-giving-trends-2025
[19] Barna Group – A New Era of Giving (August 2023): https://www.barna.com/research/young-adults-giving/
[20] Stelter / Giving USA 2024 (October 2024): https://blog.stelter.com/2024/10/30/giving-usa-2024-a-closer-look-part-iv/
[21] ReachRight Studios / Barna Research (2025): https://reachrightstudios.com/blog/church-stats-2025/
[22] OnlineGiving.org / MortarStone 2024 Annual Report: https://www.onlinegiving.org/support/the-state-of-church-giving-2025
[23] Gallup / Alabama Baptist State Board of Missions (2025): https://alsbom.org/6-recent-gallup-church-trends-and-6-responses-to-them/
[24] Gallup – How Religious Are Americans? (2024): https://news.gallup.com/poll/358364/religious-americans.aspx
[25] Gallup / Catholic Review (March 2024): https://catholicreview.org/gallup-just-3-in-10-u-s-adults-regularly-attend-religious-services/
[26] Gallup – Church Membership Down Sharply: https://news.gallup.com/poll/248837/church-membership-down-sharply-past-two-decades.aspx
[27] Horizons Stewardship (2025): https://blog.horizons.net/church-giving-and-attendance-trends-2025
[28] The Angeletti Group / Giving USA 2025 (June 2025): https://theangelettigroup.com/giving-usa-2025-report-trends-and-fundraising-insights-for-nonprofits/
[29] Lake Institute / Giving USA 2025 (July 2025): https://lakeinstitute.org/resource-library/insights/july-15-2025/
[30] Lake Institute on Faith & Giving (October 2023): https://lakeinstitute.org/resource-library/insights/oct-issue1-2023/
[31] Pushpay / Parable (2024): https://pushpay.com/blog/church-giving-statistics-and-trends/
[32] Donorbox Church Giving Statistics (2025): https://donorbox.org/nonprofit-blog/church-giving-statistics